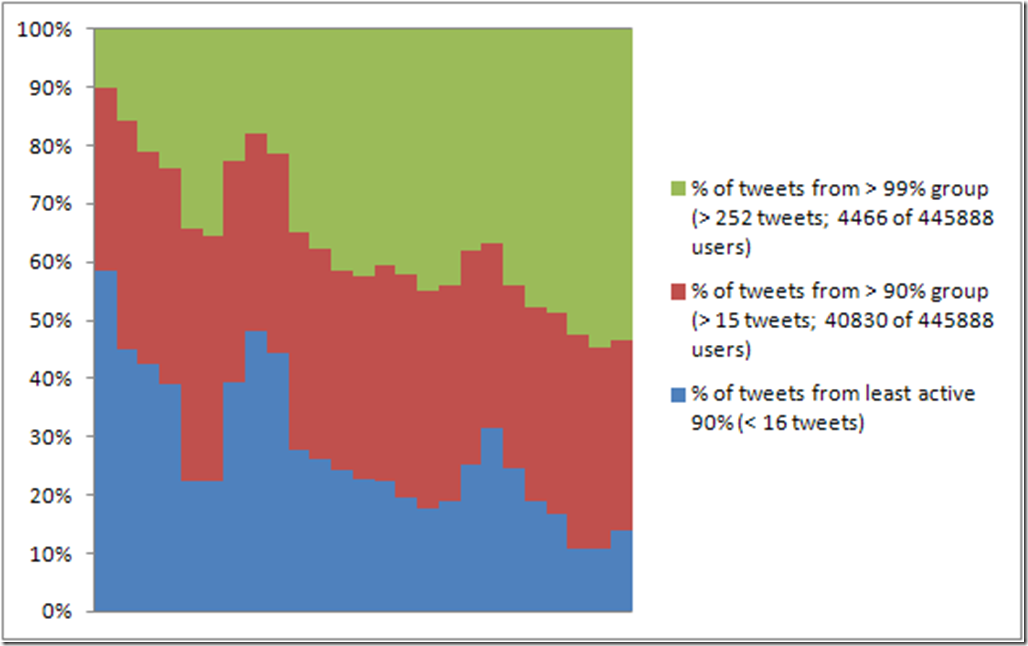
Posts Tagged ‘metrics’

More Twitter Metrics: Metrify Revisited

About a month ago I introduced my new Gawk script metrify.awk, which generates a wide range of Twitter metrics for a given Twapperkeeper/yourTwapperkeeper hashtag or keyword archive. Even as I was writing those posts, though – and certainly while playing with the language metrics I discussed in my last post –, I started to find a few areas where metrify could provide even more information on the dataset. So, the time has come for a first service release which upgrades metrify.awk to add some more functionality (and fix a few inconsistencies along the way). This is a revision rather than a full rewrite of the script, so let’s call it metrify 1.2; it’s now available for download here, where it replaces the older version.

As before, the new version of metrify.awk is called as follows:

gawk -F , -f metrify.awk time=”[year|month|day|hour|minute]” [divisions=x,y,z,…] [skipusers=1] input.csv >metrics.csv

(divisions defaults to ‘90,99’ – i.e. a 90%/9%/1% split of the userbase – if it is not specified).

Read the rest of this entry →

31

01 2012

Creating Basic Twitter Language Metrics

OK, this may be a somewhat esoteric subject for researchers who mainly work with Twitter data from specific countries and cultures, but over the past few weeks I’ve been working on a paper that analyses Twitter activities in the #egypt and #libya hashtags – and as part of that work, I’ve been interested in exploring the interactions between users tweeting in Arabic and users tweeting in other languages (mainly in English). Unfortunately, there’s no reliable means of identifying the language of specific tweets, or of the users who post them; while the Twitter API provides an ISO language code (e.g. ‘en’ for English, ‘no’ for Norwegian, etc.) for each tweet, this is drawn simply from the overall language setting of the user’s account, and not specific to each individual tweet itself. For users who alternate between languages in their tweeting, all tweets will be tagged with their chosen language code; for users who haven’t bothered to change their Twitter profile settings away from the default English, all their tweets will be tagged ‘en’, regardless of their actual language.

Read the rest of this entry →

28

01 2012

Taking Twitter Metrics to a New Level (Part 4)

Update: revision 1.2 of metrify.awk is now available (still at the link below), and introduces some further functionality, which is outlined here.

This is the final instalment of my four-part introduction to the metrify.awk script for generating detailed metrics for specific Twapperkeeper/yourTwapperkeeper hashtag archives. Over the last couple of posts, we’ve mainly dealt with overall stats for the hashtag, as well as for specific, definable percentiles of more or less active users. Finally, now, it’s time to look more closely at patterns within the overall userbase.

Read the rest of this entry →

02

01 2012

Taking Twitter Metrics to a New Level (Part 3)

Update: revision 1.2 of metrify.awk is now available (still at the link below), and introduces some further functionality, which is outlined here.

Over the past couple of posts, I’ve introduced our new metrify.awk Twitter metrics script, and looked at the first of the three metrics tables produced by the script. Let’s move on now to the second table, where I’ll use a snapshot of Australian political discussion on Twitter under the #auspol hashtag between February and August 2011, instead of #qldfloods – the overall metrics for the different user percentiles in the #qldfloods dataset turn out not to be particularly interesting… As before, we’re dividing the total userbase according to the 1/9/90 rule into the 1% of most active users, the next 9% of moderately active users, and the final 90% of least active users. (In the case of #auspol, that first percentile contains 142, the second percentile contains 1291, and the final percentile contains 12700 of a total of 14133 users.)

Read the rest of this entry →

02

01 2012

Taking Twitter Metrics to a New Level (Part 2)

Update: I’ve clarified/corrected some of the details relating to the percentile metrics contained in the first table which metrify.awk generates.

Update 2: revision 1.2 of metrify.awk adds further functionality in addition to what is described below. These changes are detailed here.

In the previous post, I’ve introduced metrify.awk, our new multi-purpose tool for generating Twitter metrics. Over the next instalments in this series of posts, I’ll take you through the results it produces. And seeing as we’re coming up to the anniversary of the January 2011 south-east Queensland floods, and as I needed to generate those metrics anyway, for a report on social media in the floods which we’re publishing soon, I’ll be using an archive of #qldfloods tweets between 10 and 17 January 2011 as an example here.

I’m running metrify.awk as follows for this:

gawk -F , -f metrify.awk divisions=90,99 time=day qldfloods.csv >qldfloods-metrics.csv

In other words, we’re using a 1/9/90 division of users, and we’re tracking activities per day; the skipusers switch is not set, so full stats for all users will be generated.

Read the rest of this entry →

02

01 2012

Taking Twitter Metrics to a New Level (Part 1)

So, 2011 is finally over – and what a year it’s been. While the confluence of natural disasters, political crises, and other major events has also provided us with the basis for a new research programme in crisis communication, let’s hope that 2012 is a little less intense, please…

To start the new year on a positive note, I’m finally getting around to sharing some more information about the new approach to generating Twitter metrics which we’ve developed over the past few months – this actually started during the research workshops we had with Stefan Stieglitz’s group at the University of Münster in August, so it’s taken some time to gestate into its present form. What it’s now turned into is quite a powerful tool for generating detailed information about a specific Twitter dataset – intended mainly for the study of hashtags, but with applications well beyond this as well. Amongst other things, it enables us to distinguish more effectively between different groups of participating users (from highly active lead users to much less active casual participants), and to track different types of participation, in total or by these specific groups, over time.

Read the rest of this entry →

02

01 2012

Talking Twitter in Amsterdam

Amsterdam.
After the ECPR conference in Reykjavík, I’ve been lucky enough to spend a week in Amsterdam, where I was invited to present a guest lecture as part of the festive opening of the University of Amsterdam’s ‘new media season’: the official welcoming of the 2011/12 cohort of students in the MA in New Media. My talk presented an overview of our work in Mapping Online Publics so far, with special attention to our work on Twitter. In particular, I spoke about the role of Twitter during the Queensland floods and other crises, as well as our recent breakthroughs in identifying different tweeting activities taking place in the context of different hashtags.

Below are my slides for the talk, with audio (unfortunately I placed my voice recorder in front of the laptop exhaust fan, resulting in a very noisy recording that needed substantial noise reduction, so the audio quality is somewhat below par…). My sincere thanks to Richard Rogers for the invitation to speak to the MA students – looks like a very exciting course.

Read the rest of this entry →

05

09 2011

A Quick Update from Reykjavík: New Metrics!

Jean and I are currently at the European Consortium for Political Research conference in Reykjavík, where we’ve presented a paper about hashtags today. Below is our presentation (with audio), which also includes some new hashtag metrics we cooked up during our week-long workshop with our ATN-DAAD project partners at the University of Münster last week. More on this soon! The full paper is also online.

27

08 2011

Popular Uses of YouTube in Italy and Australia: Part 1

I’m writing this from the University of Urbino, where I am spending a week as an academic visitor, leading up to a one-day mini-conference on research methods on Thursday, which I’ll blog about in a few days’ time.

Since I’m here, I thought it might be useful to do a quick comparative study of the popular uses of YouTube, looking at Italy and Australia, – Australia because obviously that’s the focus of our current project; and Italy because, well, I’m here and have access to local knowledge, and I think there could be some interesting similarities and differences. Also, Axel and I are gearing up for the ECREA pre-conference ‘Doing Global Media Studies’ in a few weeks’ time – while we’ll be discussing the blog and twitter mapping we’ve been doing, the issues of working within and across ‘national containers’ is currently at the front of my mind.

I am going to post these preliminary research notes on YouTube in Italy and Australia in two parts:

1. A look at the 20 most viewed videos of all time, comparing the Australian and Italian versions (that’s this post)
2. A look at the 20 most subscribed channels in the same locations (that’s the next post).

Read the rest of this entry →

29

09 2010